
Chemistry
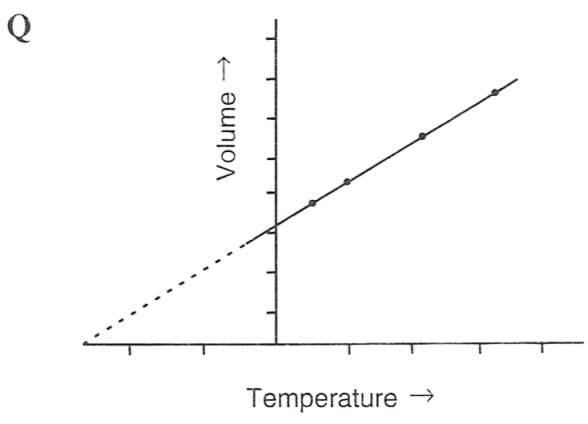
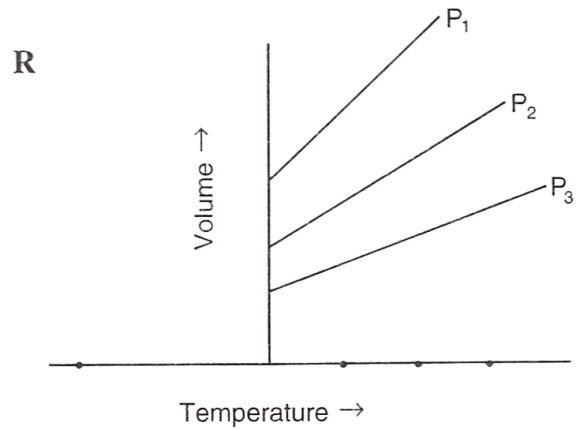
Following figures illustrate graphical representations of gas laws. the figure which represents Charles' law is/are :
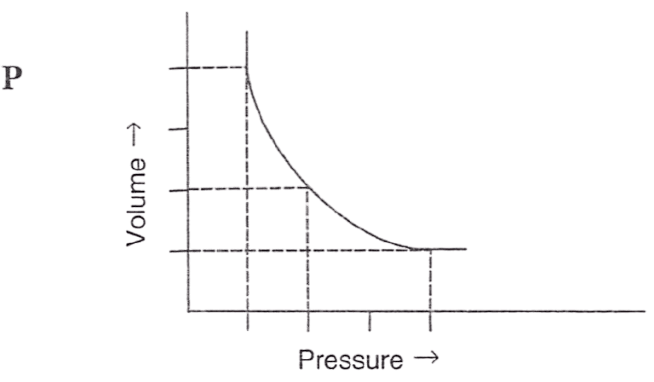
- Only P
- Only Q
- Only R
- Both Q and R
Gas Laws
4 Likes
Answer
Both Q and R
Reason — In graph Q and R, the relationship between volume and temperature of gas is plotted at constant pressure. The straight line proves that volume is directly proportional to temperature (at constant pressure) as per Charles' law.
Answered By
2 Likes
Related Questions
The volume of a given mass of a gas at constant temperature and 10 atmospheric pressure is 10 litres. Its volume at 5 atmospheres will be :
- 5 litres
- 10 litres
- 15 litres
- 20 litres
STP is called standard temperature and pressure. The standard temperature and standard pressure respectively are :
- 273 K and 760 mm
- 0°C and 760 cm
- 273°C and 1 atmosphere
- 373 K and 76 cm
The term used for the graph of volume vs pressure for the verification of Boyle's law is :
P — Isobar
Q — Isotherm
R — Isotope
- Only P
- Only Q
- Only R
- Both P and Q
Assertion (A): Inflating a balloon seems to violate Boyle's law.
Reason (R): Boyle's law is valid for a fixed mass. Here, the mass of gas is changing.
- Both A and R are true and R is the correct explanation of A.
- Both A and R are true but R is not the correct explanation of A.
- A is true but R is false.
- A is false but R is true.