
Mathematics
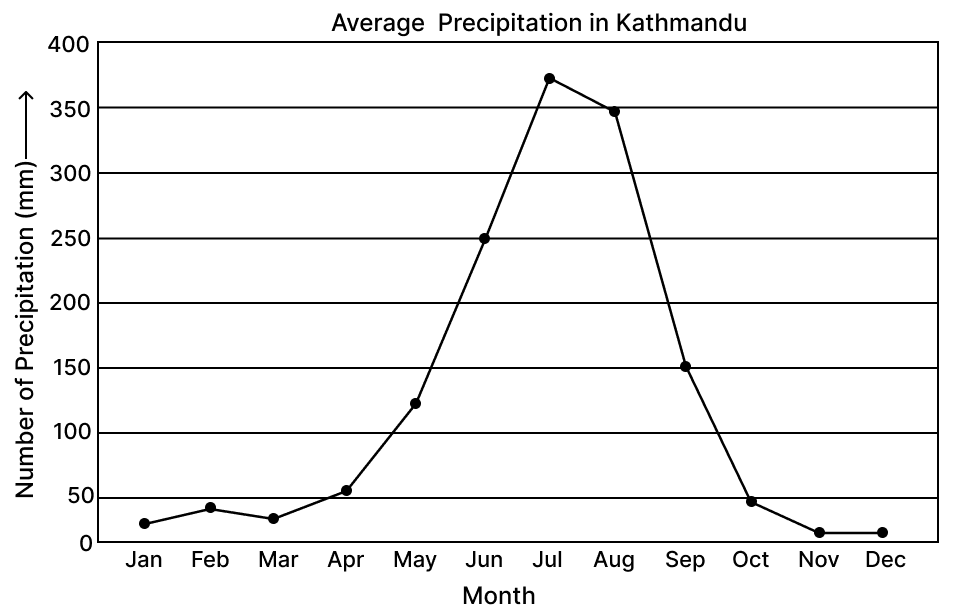
The frequency Polygon shown depicts the monthly rainfall in the Kathmandu (Nepal).
Answer the following :
(i) Which month had the highest rainfall?
(ii) How many months had rainfall above 200 mm ?
(iii) How many months had rainfall below 100 mm ?
(iv) Calculate the Mean rainfall in the months from June to September.
Statistics
1 Like
Answer
(i) Highest point on the graph is in July.
Hence, July month had the highest rainfall.
(ii) Months with rainfall above 200 mm are:
June, July and August.
Hence, there are 3 months with rainfall above 200 mm.
(iii) Months with rainfall below 100 mm are :
Jan, Feb, March, April, Oct, Nov and Dec.
Hence, there are 7 months with rainfall below 100 mm.
(iv) Rainfall from June to September are:
Jun (250 mm)
Jul (375 mm)
Aug (350 mm)
Sep (150 mm)
Mean =
= .
Hence, mean rainfall from June to September = 281.25 mm.
Answered By
2 Likes
Related Questions
The average of n numbers x1, x2, x3 ……………, xn is A. If x1 is replaced by (x + a)x1, x2 is replaced by (x + a)x2 and so on. Find the new average.
The heights (in cm) of the volley-ball players from team A and team B were recorded as :
Team A : 180, 178, 176, 181, 190, 175, 187
Team B : 174, 175, 190, 179, 178, 185, 177
Which team had the greater average height ? Find the median of team A and team B.
The mean of the following arrayed data 5, 8, (3x - 1), (4x + 1), (3x + 7) is equal to its median. Find the value of x.
The data representing the number of people in municipalities in different towns is shown by the bar graph given below.
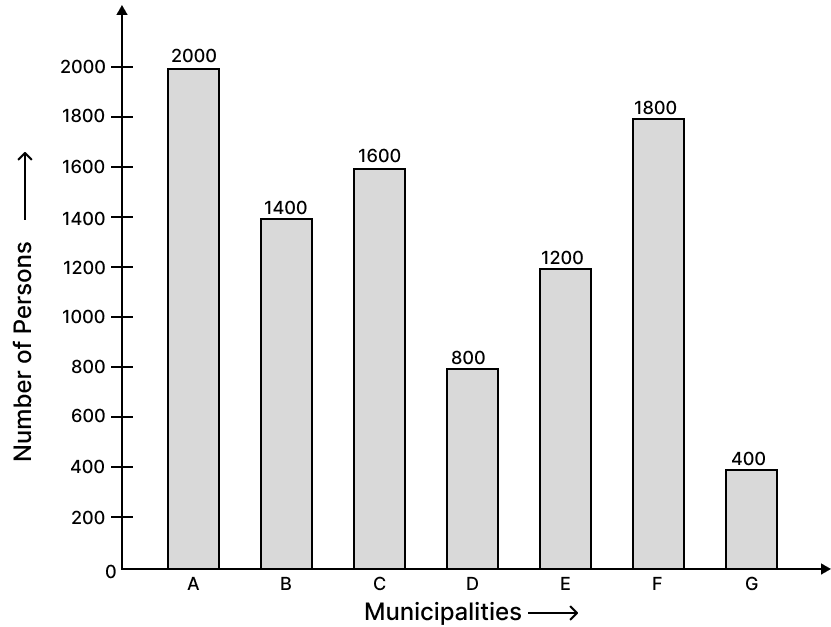
(i) What is the number of people living in municipality F ?
(ii) What is the total number of people living in municipalities A to C ?
(iii) What is the total population of all the municipalities under consideration ?
(iv) What the average (mean) of people living in municipalities B to E ?