
Mathematics
Marks obtained by 200 students in an examination are given below :
| Marks | No. of students |
|---|---|
| 0 - 10 | 5 |
| 10 - 20 | 11 |
| 20 - 30 | 10 |
| 30 - 40 | 20 |
| 40 - 50 | 28 |
| 50 - 60 | 37 |
| 60 - 70 | 40 |
| 70 - 80 | 29 |
| 80 - 90 | 14 |
| 90 - 100 | 6 |
Draw an ogive for the given distribution taking 2 cm = 10 marks on one axis and 2 cm = 20 students on the other axis. Using the graph, determine :
(i) The median marks
(ii) The number of students who failed if minimum marks required to pass is 40 ?
(iii) If scoring 85 and more marks is considered as grade one, find the number of students who secured grade one in the examination ?
Measures of Central Tendency
32 Likes
Answer
(i) Cumulative frequency distribution table :
| Marks | No. of students | Cumulative frequency |
|---|---|---|
| 0 - 10 | 5 | 5 |
| 10 - 20 | 11 | 16 |
| 20 - 30 | 10 | 26 |
| 30 - 40 | 20 | 46 |
| 40 - 50 | 28 | 74 |
| 50 - 60 | 37 | 111 |
| 60 - 70 | 40 | 151 |
| 70 - 80 | 29 | 180 |
| 80 - 90 | 14 | 194 |
| 90 - 100 | 6 | 200 |
Here, n = 200, which is even.
By formula,
Median = th term
= = 100th term.
Steps of construction :
Take 1 cm along x-axis = 10 marks.
Take 1 cm along y-axis = 20 students.
Plot the point (0, 0) as ogive starts from x-axis representing lower limit of first class.
Plot the points (10, 5), (20, 16), (30, 26), (40, 46), (50, 74), (60, 111), (70, 151), (80, 180), (90, 194) and (100, 200).
Join the points by a free hand curve.
Draw a line parallel to x-axis from point L (no. of students) = 100, touching the graph at point M. From point M draw a line parallel to y-axis touching x-axis at point N.
From graph, N = 57
Hence, median = 57.
(ii) Minimum marks required to pass = 40.
Draw a line parallel to y-axis from point O (marks) = 40, touching the graph at point Q. From point Q draw a line parallel to x-axis touching y-axis at point P.
From graph,
P = 46.
∴ 46 students scored less than 40 marks.
Hence, 46 students failed the examination.
(iii) 85 or more marks is considered grade one.
Draw a line parallel to y-axis from point Q (marks) = 85, touching the graph at point R. From point R draw a line parallel to x-axis touching y-axis at point S.
From graph,
S = 188.
∴ 188 students scored less than 85 marks.
∴ 12 (200 - 188) students scored more than 85 marks.
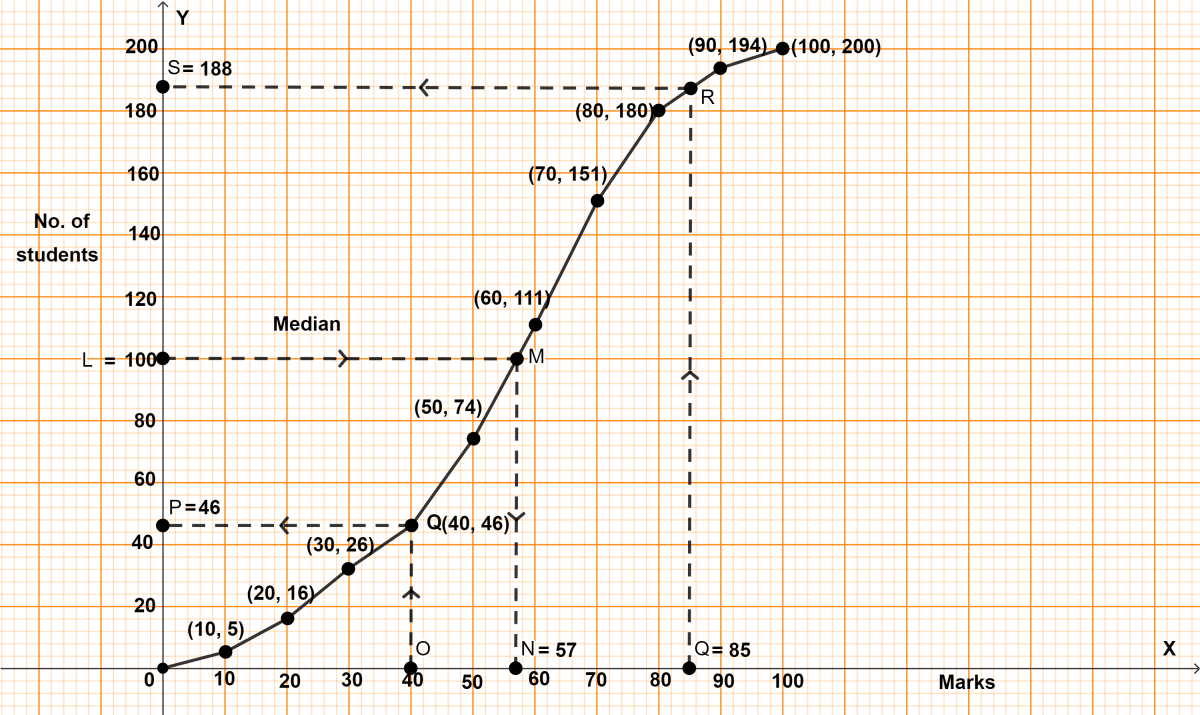
Hence, 12 students secured grade one.
Answered By
22 Likes
Related Questions
The monthly income of a group of 320 employees in a company is given below :
Monthly income No. of employees 6 - 7 20 7 - 8 45 8 - 9 65 9 - 10 95 10 - 11 60 11 - 12 30 12 - 13 5 Draw an ogive of the given distribution on a graph sheet taking 2 cm = ₹ 1000 on one axis and 2 cm = 50 employees on the other axis. From the graph determine :
(i) the median wage.
(ii) the number of employees whose income is below ₹ 8500.
The mean of numbers 45, 52, 60, x, 69, 70, 26, 81 and 94 is 68. Find the value of x. Hence, estimate the median for the resulting data.
The marks of 10 students of a class in an examination arranged in ascending order is as follows :
13, 35, 43, 46, x, x + 4, 55, 61, 71, 80.
If the median marks is 48, find the value of x. Hence, find the mode of the given data.
The histogram below represents the scores obtained by 25 students in a Mathematics mental test. Use the data to :
(i) Frame a frequency distribution table.
(ii) To calculate mean.
(iii) To determine the modal class.
