Mathematics
Study the graph and answer the questions that follow :
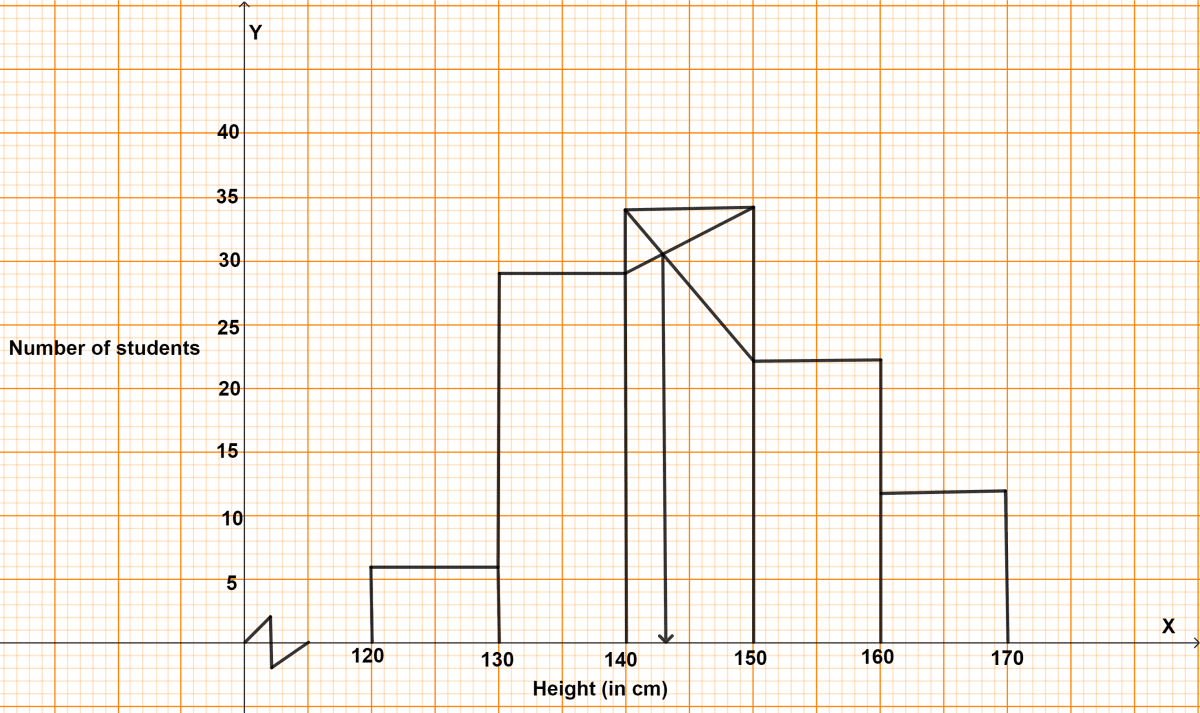
(a) Make a frequency table for the information provided in the graph.
(b) The number of students whose height is less than 150 cm.
(c) The total number of students.
(d) The modal height.
(e) The difference in the modal height and the mean height, if the average height of the students is 145.5 cm.
Answer
(a)
| Class | Frequency (f) | Cumulative frequency (c.f.) |
|---|---|---|
| 120-130 | 6 | 6 |
| 130-140 | 29 | 35 |
| 140-150 | 34 | 69 |
| 150-160 | 22 | 91 |
| 160-170 | 12 | 103 |
(b) From the above table,
The number of students whose height is less than 150 cm = 69.
(c) From the above table,
The total number of students = 103.
(d) From graph,
The modal height = 143 cm.
(e) Mean height = Average height = 145.5
Difference in the modal height and the mean height :
145.5 - 143 = 2.5 cm
Hence, difference between modal height and the mean height = 2.5 cm
Related Questions
Plot the points A(2, 2) and B(6, -2) in the graph and answer the following :
(a) Reflect points A in origin to point D and write the co-ordinates of point D.
(b) Reflect points A in line y = -2 to point C and write the co-ordinates of point C.
(c) Find a point P on CD which is invariant under reflection in x = 0, write its co-ordinates.
(d) Write the geometrical name of the closed figure ABCD.
(e) Write the co-ordinates of the point of intersection of the diagonals of ABCD.
Plot points A(0, 3), B(4, 0), C(6, 2) and D(5, 0). Reflect the points as given below and write their coordinates :
(a) Reflect A on x-axis to A’.
(b) Reflect B on y-axis to B’.
(c) Reflect C on x-axis to C’.
(d) D remain invariant when reflected on the line whose equation is …………… .
(e) Join the points A, B, C, D, C’, B, A’, B’ and A to form a closed figure. Name the closed figure BCDC’.
The following data represents the daily wages in rupees of a certain number of employees of a company :
Daily wages (in ₹) No. of Employees 30-40 8 40-50 14 50-60 12 60-70 17 70-80 20 80-90 26 90-100 13 100-110 10 Use a graph to answer the following questions :
(a) Represent the above distribution by an ogive.
(b) Find the following on the graph drawn:
(i) median wage.
(ii) percentage of employees who earn more than ₹ 84 per day.
(iii) number of employees who earn ₹56 and below.
Construct a combined histogram and frequency polygon for the following frequency distribution :
Class-intervals 20 - 30 30 - 40 40 - 50 50 - 60 60 - 70 Frequency 8 12 15 10 3