
Mathematics
The daily pocket expenses of 200 students in a school are given below :
| Pocket expenses (in ₹) | No. of students (frequency) |
|---|---|
| 0 - 5 | 10 |
| 5 - 10 | 14 |
| 10 - 15 | 28 |
| 15 - 20 | 42 |
| 20 - 25 | 50 |
| 25 - 30 | 30 |
| 30 - 35 | 14 |
| 35 - 40 | 12 |
Draw a histogram representing the above distribution and estimate the mode from the graph.
Measures of Central Tendency
2 Likes
Answer
Steps :
Draw a histogram of the given distribution.
Inside the highest rectangle, which represents the maximum frequency (or modal class), draw two lines LO and ND diagonally from the upper corners N and O of adjacent rectangles.
Through point P (the point of intersection of diagonals LO and ND), draw PR perpendicular to the horizontal axis.
The value of point R on the horizontal axis represents the value of mode.
∴ Mode = 21.5
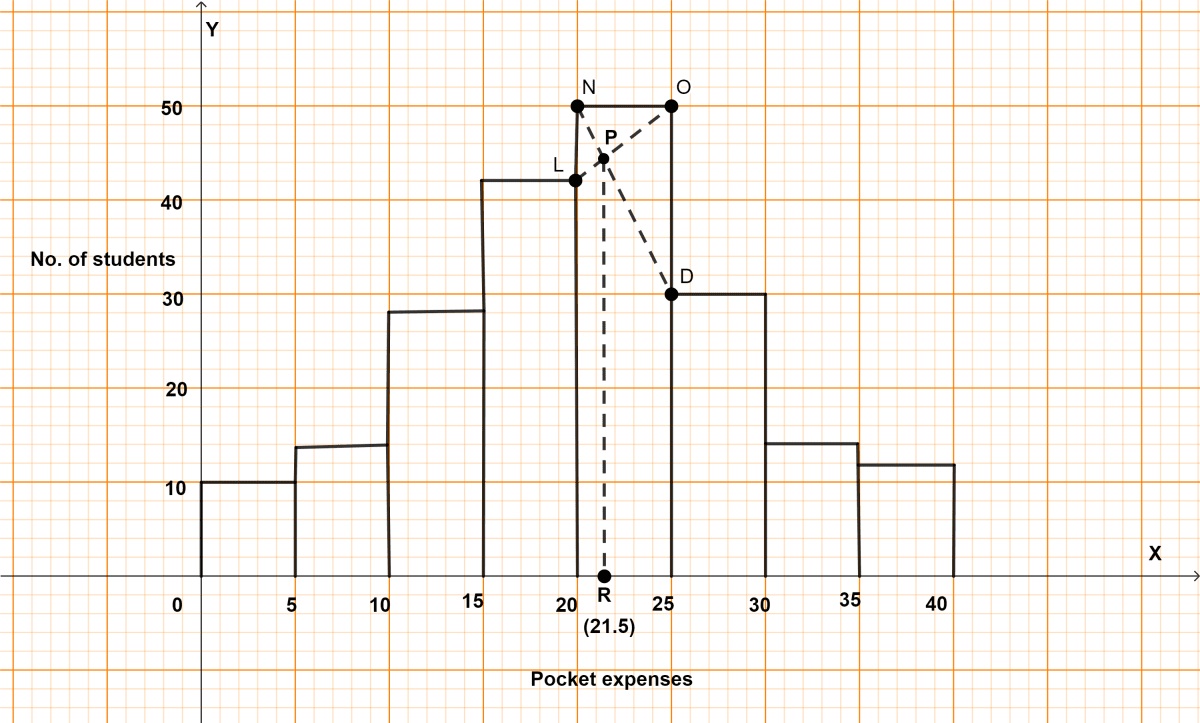
Hence, mode = 21.5
Answered By
1 Like
Related Questions
The monthly income of a group of 320 employees in a company is given below :
Monthly income No. of employees 6 - 7 20 7 - 8 45 8 - 9 65 9 - 10 95 10 - 11 60 11 - 12 30 12 - 13 5 Draw an ogive of the given distribution on a graph sheet taking 2 cm = ₹ 1000 on one axis and 2 cm = 50 employees on the other axis. From the graph determine :
(i) the median wage.
(ii) the number of employees whose income is below ₹ 8500.
The mean of numbers 45, 52, 60, x, 69, 70, 26, 81 and 94 is 68. Find the value of x. Hence, estimate the median for the resulting data.
The marks of 10 students of a class in an examination arranged in ascending order is as follows :
13, 35, 43, 46, x, x + 4, 55, 61, 71, 80.
If the median marks is 48, find the value of x. Hence, find the mode of the given data.
The histogram below represents the scores obtained by 25 students in a Mathematics mental test. Use the data to :
(i) Frame a frequency distribution table.
(ii) To calculate mean.
(iii) To determine the modal class.
