
Mathematics
The incomes of the parents of 100 students in a class in a certain university are tabulated below.
| Income (in thousand ₹) | No. of students |
|---|---|
| 0 - 8 | 8 |
| 8 - 16 | 35 |
| 16 - 24 | 35 |
| 24 - 32 | 14 |
| 32 - 40 | 8 |
(i) Draw a cumulative frequency curve to estimate the median income.
(ii) If 15% of the students are given freeships on the basis of the income of their parents, find the annual income of parents, below which the freeships will be awarded.
(iii) Calculate the Arithmetic mean.
Measures of Central Tendency
13 Likes
Answer
(i) Cumulative frequency distribution table :
| Income (in thousand ₹) | No. of students(frequency) | Cumulative frequency |
|---|---|---|
| 0 - 8 | 8 | 8 |
| 8 - 16 | 35 | 43 (8 + 35) |
| 16 - 24 | 35 | 78 (43 + 35) |
| 24 - 32 | 14 | 92 (78 + 14) |
| 32 - 40 | 8 | 100 (92 + 8) |
Here, n = 100, which is even.
Median = = 50th term.
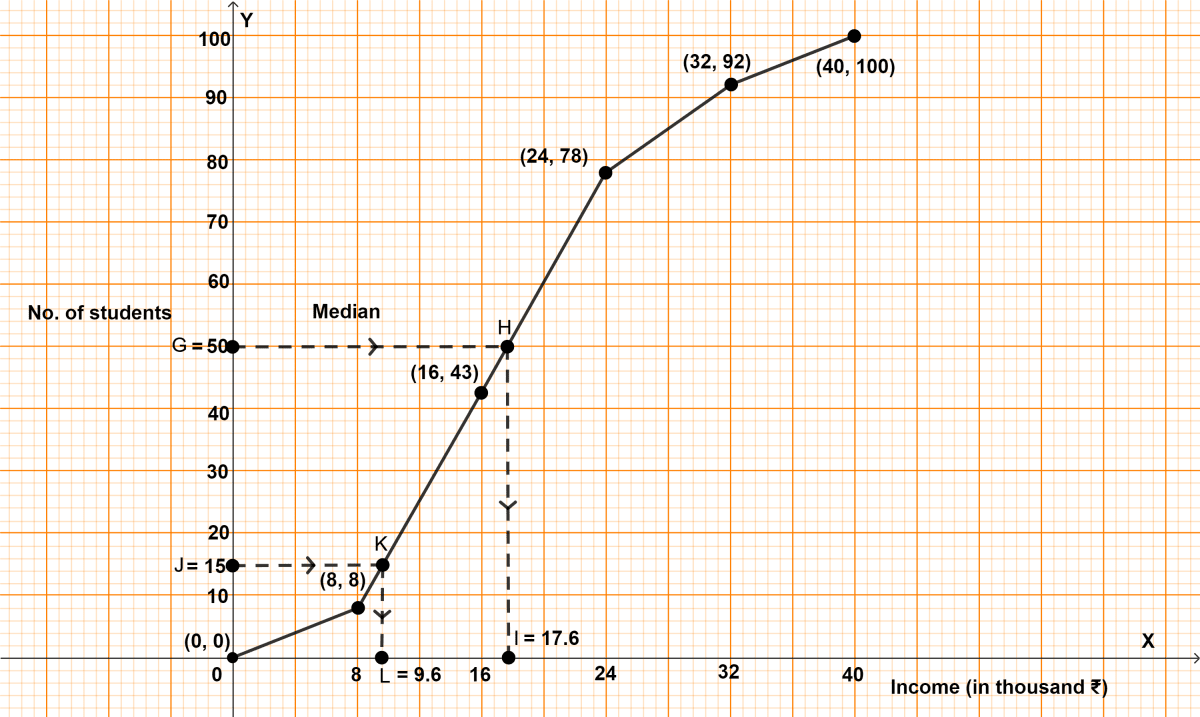
Steps of construction of ogive :
Take 2 cm = 8 thousand on x-axis.
Take 1 cm = 10 students on y-axis.
Plot the point (0, 0) as ogive starts from x-axis representing the lower limit of first class.
Plot the points (8, 8), (16, 43), (24, 78), (32, 92) and (40, 100).
Join the points by a free hand curve.
Draw a line parallel to x-axis from point G (no. of students) = 50, touching the graph at point H. From point H draw a line parallel to y-axis touching x-axis at point I.
From graph, I = 17.6 (thousands)
Hence, median = 17.6 thousands.
(ii) 15% of 100 students = = 15.
Draw a line parallel to x-axis from point J (no. of students) = 15, touching the graph at point K. From point K draw a line parallel to y-axis touching x-axis at point L.
From graph,
L = 9.6 thousands.
Hence, the annual income of parents, below which the freeships will be awarded is 9.6 thousands.
(iii)
| Income (in thousand ₹) | Class mean (x) | No. of students (f) | fx |
|---|---|---|---|
| 0 - 8 | 4 | 8 | 32 |
| 8 - 16 | 12 | 35 | 420 |
| 16 - 24 | 20 | 35 | 700 |
| 24 - 32 | 28 | 14 | 392 |
| 32 - 40 | 36 | 8 | 288 |
| Total | Σf = 100 | Σfx = 1832 |
Mean = = 18.32 (thousands)
Hence, mean = 18.32 (thousands).
Answered By
7 Likes
Related Questions
The monthly income of a group of 320 employees in a company is given below :
Monthly income No. of employees 6 - 7 20 7 - 8 45 8 - 9 65 9 - 10 95 10 - 11 60 11 - 12 30 12 - 13 5 Draw an ogive of the given distribution on a graph sheet taking 2 cm = ₹ 1000 on one axis and 2 cm = 50 employees on the other axis. From the graph determine :
(i) the median wage.
(ii) the number of employees whose income is below ₹ 8500.
The mean of numbers 45, 52, 60, x, 69, 70, 26, 81 and 94 is 68. Find the value of x. Hence, estimate the median for the resulting data.
The marks of 10 students of a class in an examination arranged in ascending order is as follows :
13, 35, 43, 46, x, x + 4, 55, 61, 71, 80.
If the median marks is 48, find the value of x. Hence, find the mode of the given data.
The histogram below represents the scores obtained by 25 students in a Mathematics mental test. Use the data to :
(i) Frame a frequency distribution table.
(ii) To calculate mean.
(iii) To determine the modal class.
