
Mathematics
The result of a examination is tabulated below :
| Marks (less than) | No. of candidates |
|---|---|
| 10 | 0 |
| 20 | 25 |
| 30 | 42 |
| 40 | 65 |
| 50 | 95 |
| 60 | 120 |
| 70 | 128 |
| 80 | 135 |
| 90 | 148 |
| 100 | 150 |
Draw the ogive for the above data and from it determine :
(i) the number of candidates who got marks less than 45.
(ii) the number of candidates who got marks more than 75.
Statistics
13 Likes
Answer
The above table can be written as :
| Marks | No. of candidates |
|---|---|
| 0 - 10 | 0 |
| 10 - 20 | 25 |
| 20 - 30 | 42 |
| 30 - 40 | 65 |
| 40 - 50 | 95 |
| 50 - 60 | 120 |
| 60 - 70 | 128 |
| 70 - 80 | 135 |
| 80 - 90 | 148 |
| 90 - 100 | 150 |
Steps of construction :
Take 1 cm = 10 marks on x-axis.
Take 1 cm = 20 students on y-axis.
Plot the point (0, 0) as ogive starts on x-axis representing lower limit of first class.
Plot the points (10, 0), (20, 25), (30, 42), (40, 65), (50, 95), (60, 120), (70, 128), (80, 135), (90, 148) and (100, 150).
Join the points by a free-hand curve.
Draw a line parallel to y-axis from point L (marks) = 45, touching the graph at point M. From point M draw a line parallel to x-axis touching y-axis at point N.
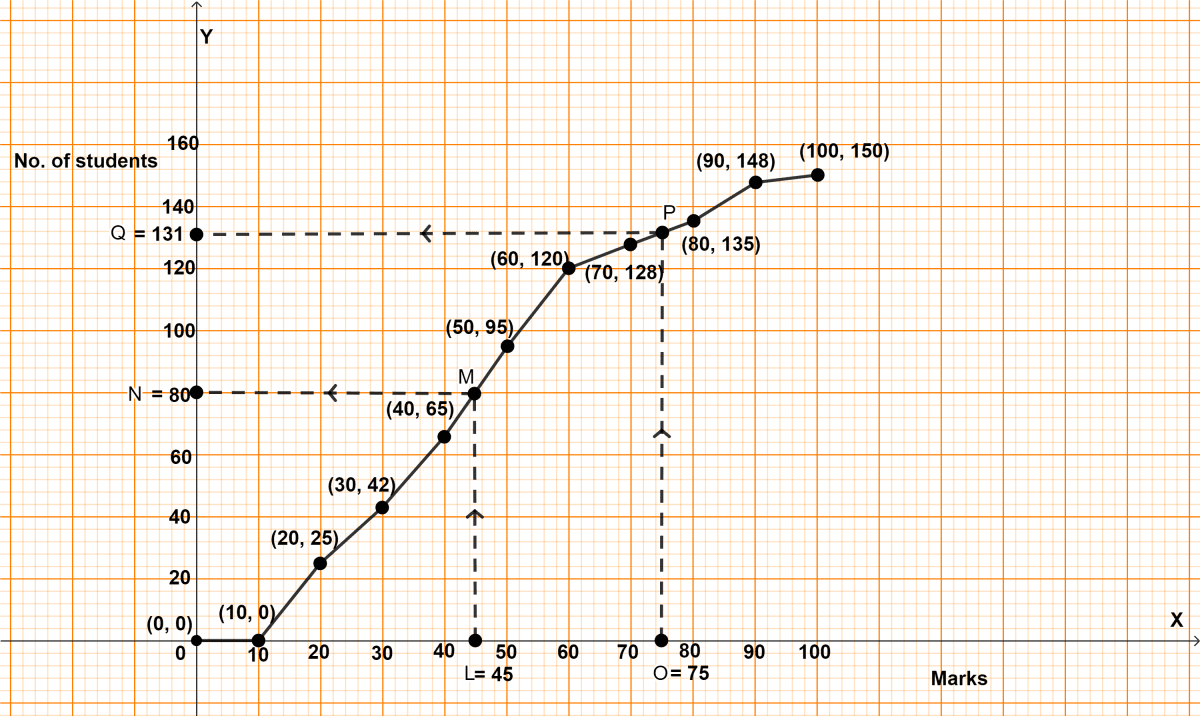
From graph, N = 80
Hence, no. of students having marks less than 45 = 80.
(ii) Steps :
- Draw a line parallel to y-axis from point O (marks) = 75, touching the graph at point P. From point P draw a line parallel to x-axis touching y-axis at point Q.
From graph, Q = 131
It means that,
131 students have marks less than or equal to 75.
∴ No. of students having marks more than 75 = 150 - 131 = 19.
Hence, no. of students having marks more than 75 = 19.
Answered By
6 Likes
Related Questions
The incomes of the parents of 100 students in a class in a certain university are tabulated below.
Income (in thousand ₹) No. of students 0 - 8 8 8 - 16 35 16 - 24 35 24 - 32 14 32 - 40 8 (i) Draw a cumulative frequency curve to estimate the median income.
(ii) If 15% of the students are given freeships on the basis of the income of their parents, find the annual income of parents, below which the freeships will be awarded.
(iii) Calculate the Arithmetic mean.
Draw an ogive for the following distribution :
Income in ₹ No. of employees 120 - 140 30 140 - 160 72 160 - 180 90 180 - 200 80 200 - 220 70 220 - 240 28 Use the ogive drawn to determine :
(i) the median income,
(ii) the number of employees whose income exceeds ₹ 190.
Marks obtained by 200 students in an examination are given below :
Marks No. of students 0 - 10 5 10 - 20 11 20 - 30 10 30 - 40 20 40 - 50 28 50 - 60 37 60 - 70 40 70 - 80 29 80 - 90 14 90 - 100 6 Draw an ogive for the given distribution taking 2 cm = 10 marks on one axis and 2 cm = 20 students on the other axis. Using the graph, determine :
(i) The median marks
(ii) The number of students who failed if minimum marks required to pass is 40 ?
(iii) If scoring 85 and more marks is considered as grade one, find the number of students who secured grade one in the examination ?
Marks obtained by 40 students in a short assessment is given below, where a and b are two missing data.
Marks Number of students 5 6 6 a 7 16 8 13 9 b If the mean of the distribution is 7.2, find a and b.