Mathematics
Use a graph for this question. Draw an ogive for the given distribution. From the graph determine :
(i) the median
| Marks | No. of students |
|---|---|
| 0-10 | 5 |
| 10-20 | 10 |
| 20-30 | 14 |
| 30-40 | 21 |
| 40-50 | 25 |
| 50-60 | 34 |
| 60-70 | 36 |
| 70-80 | 27 |
| 80-90 | 16 |
| 90-100 | 12 |
(ii) the number of students scoring above 65 marks.
(iii) if 10 students qualify for merit scholarship, find the minimum marks required to qualify.
(iv) the number of students who did not pass, if the pass percentage was 35.
Related Questions
If a, b and c are in continued proportion, prove that :
abc(a + b + c)3 = (ab + bc + ca)3.
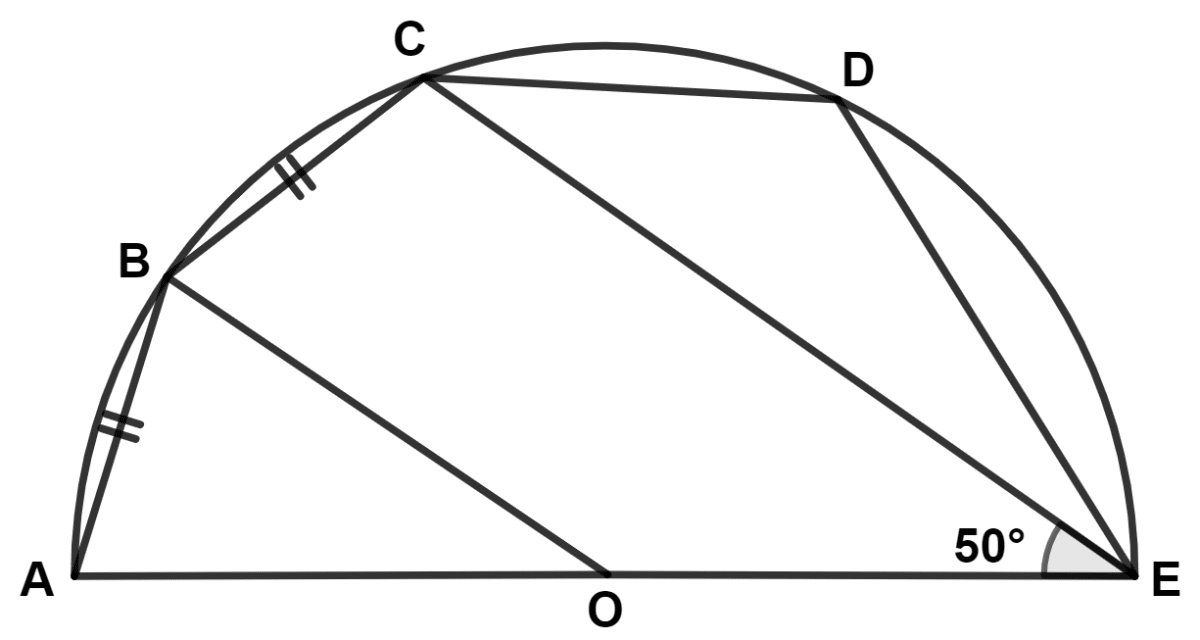
The given figure shows a semicircle with center at point O and AE as diameter. Chord AB = chord BC and angle CEO = 50°.
(i) Find angle AOB.
(ii) Show that OB is parallel to EC.
The quadratic equation x2 + x + p = 0 has real and distinct roots, find the value of p.