Mathematics
Using a graph paper, draw an ogive for the following distribution which shows a record of weight in kilograms of 100 students.
| Weight (in kg) | Number of students |
|---|---|
| 35 – 40 | 4 |
| 40 – 45 | 6 |
| 45 – 50 | 10 |
| 50 – 55 | 24 |
| 55 – 60 | 26 |
| 60 – 65 | 17 |
| 65 – 70 | 8 |
| 70 – 75 | 5 |
Use your ogive to estimate the following:
(a) the median weight of the students.
(b) percentage of students whose weight is 60 kg or more.
(c) the weight above which 20% of the students lie.
Related Questions
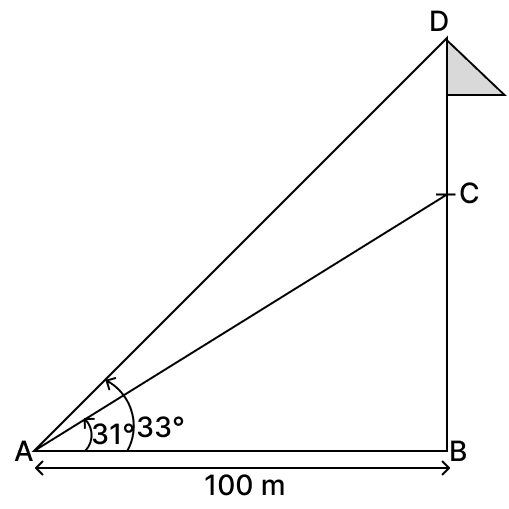
A flagpole is erected at the top of a building. The angle of elevation of the top and foot of the flagpole from a point 100 m away, on the same level as that of the foot of the building, are 33° and 31° respectively. Find the height of the flagpole. Give your answer correct to the nearest metre.
Rohit and Vinay both opened a recurring deposit account in a bank for 2 years at 8% simple interest. Vinay deposited ₹ 300 per month. On maturity, Rohit’s interest was ₹ 800 more than Vinay’s interest. Find:
(a) interest earned by Vinay.
(b) sum deposited by Rohit every month.
The fourth term of a Geometric Progression (G.P.) is 16 and its seventh term is 128. Find its:
(a) common ratio
(b) first term