Mathematics
Use graph paper to answer this question.
During a medical checkup of 60 students in a school, weights were recorded as follows :
| Weight (in kg) | Number of students |
|---|---|
| 28-30 | 2 |
| 30-32 | 4 |
| 32-34 | 10 |
| 34-36 | 13 |
| 36-38 | 15 |
| 38-40 | 9 |
| 40-42 | 5 |
| 42-44 | 2 |
Taking 2 cm = 2 kg along one axis and 2 cm = 10 students along the other axis draw an ogive. Use your graph to find the :
(a) median
(b) upper quartile
(c) number of students whose weight is above 37 kg.
Related Questions
Which term of the Arithmetic Progression (A.P.) 15, 30, 45, 60 ….. is 300 ? Hence find the sum of all terms of the Arithmetic Progression (A.P.).
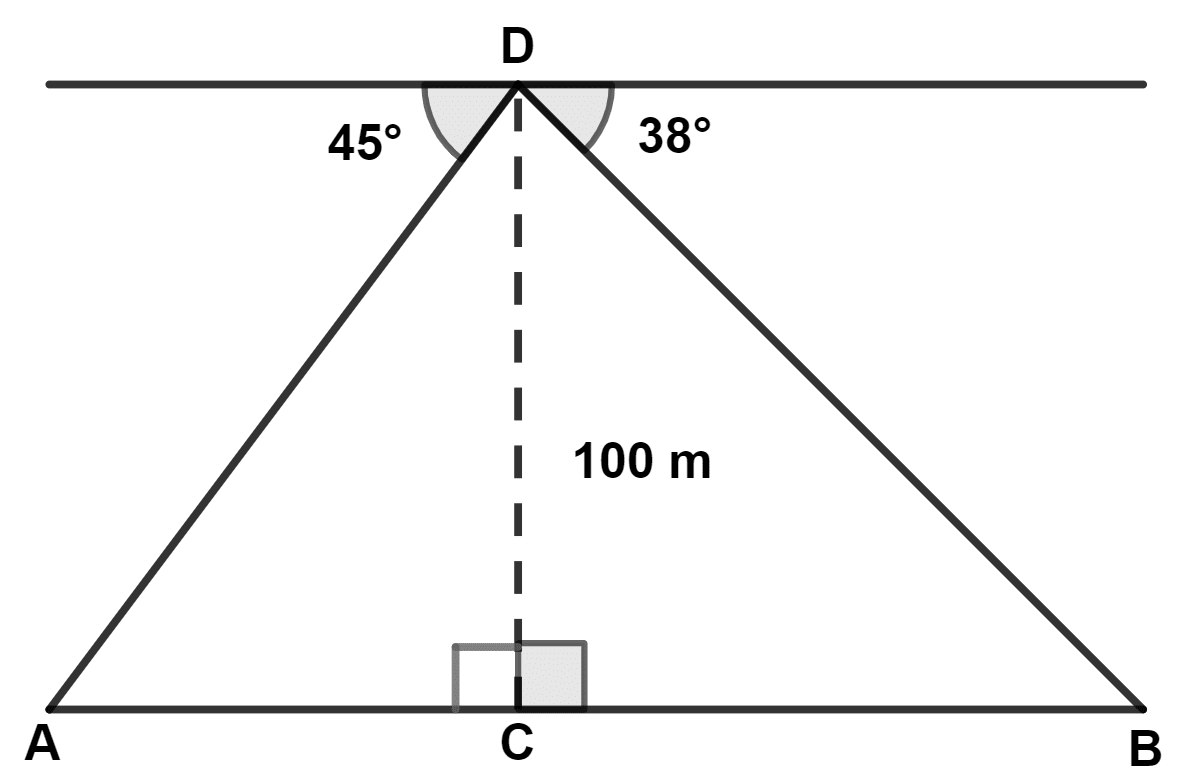
From the top of a tower 100 m high, a man observes the angle of depression of two ships A and B, on opposite sides of the tower as 45° and 38° respectively. If the foot of tower and the ships are in the same horizontal line, find the distance between two ships A and B to the nearest metre.
Factorize completely using factor theorem : 2x3 - x2 - 13x - 6.