Mathematics
Use graph (squared paper) to solve this question.
(i) Draw the ogive for the following frequency distribution.
| Marks | No. of students |
|---|---|
| 0-9 | 5 |
| 10-19 | 9 |
| 20-29 | 16 |
| 30-39 | 22 |
| 40-49 | 26 |
| 50-59 | 18 |
| 60-69 | 11 |
| 70-79 | 6 |
| 80-89 | 4 |
| 90-99 | 3 |
Use your graph to find :
(ii) the median
(iii) the number of students who secured more than 75% marks.
Statistics
18 Likes
Answer
(i) The class intervals are discontinuous.
By formula,
Adjustment factor
New lower class limit = Lower class limit - Adjustment factor
New upper class limit = Upper class limit + Adjustment factor
| Marks | New class limit | No. of students | Cumulative frequency |
|---|---|---|---|
| 0-9 | -0.5-9.5 | 5 | 5 |
| 10-19 | 9.5-19.5 | 9 | 14 |
| 20-29 | 19.5-29.5 | 16 | 30 |
| 30-39 | 29.5-39.5 | 22 | 52 |
| 40-49 | 39.5-49.5 | 26 | 78 |
| 50-59 | 49.5-59.5 | 18 | 96 |
| 60-69 | 59.5-69.5 | 11 | 107 |
| 70-79 | 69.5-79.5 | 6 | 113 |
| 80-89 | 79.5-89.5 | 4 | 117 |
| 90-99 | 89.5-99.5 | 3 | 120 |
Steps of construction :
Take 1 cm = 10 marks on x-axis.
Take 1 cm = 20 students on y-axis.
A kink is drawn near x-axis to show that the scale begins at 9.5
Plot the points (-0.5, 0), (9.5, 5), (19.5, 14), (29.5, 30), (39.5, 52), (49.5, 78), (59.5, 96), (69.5, 107), (79.5, 113), (89.5, 117) and (99.5, 120).
Join the points by a free-hand curve.
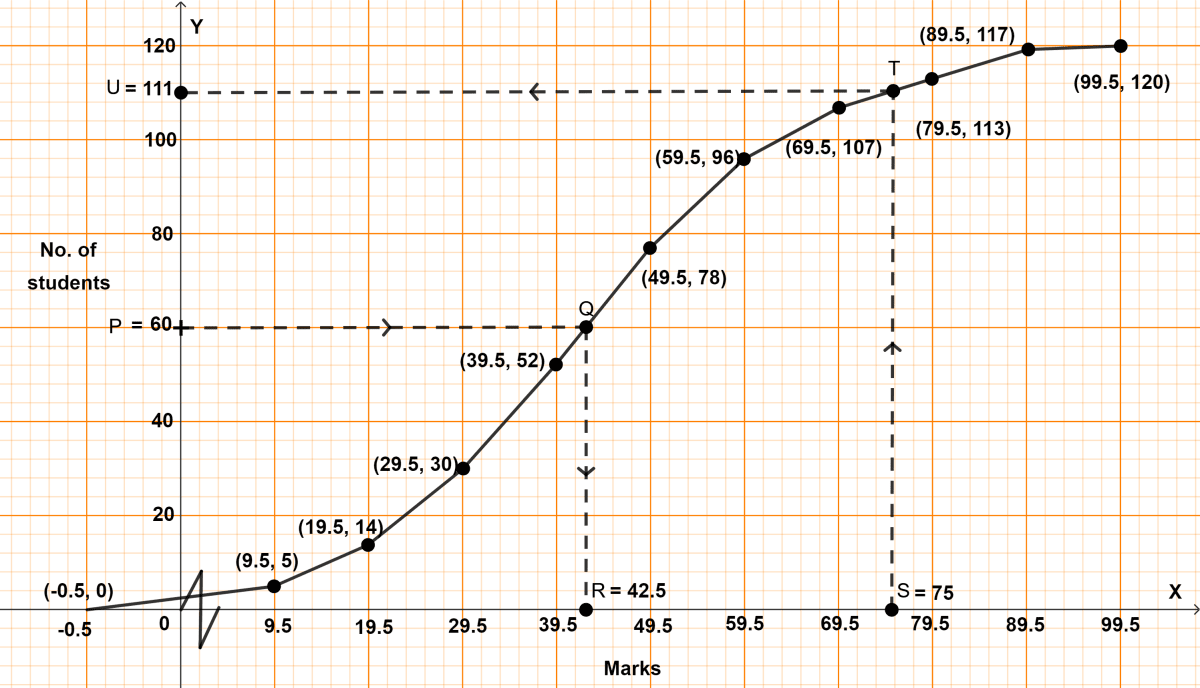
(i) Median = = 60th term
Through P = 60, draw a horizontal line parallel to x-axis touching the ogive at point Q. From point Q draw a vertical line parallel to y-axis touching x-axis at R.
From graph,
R = 42.5
Hence, median = 42.5
(ii) Total marks = 100
75% of marks = 75
Through S = 75, draw a vertical line parallel to y-axis touching the ogive at point T. From point T draw a horizontal line parallel to x-axis touching y-axis at U.
From graph,
U = 111
∴ 111 students secured less than or equal to 75%
∴ 9 (120 - 111) students scored more than 75%.
Hence, 9 students scored more than 75% marks.
Answered By
8 Likes