Physics
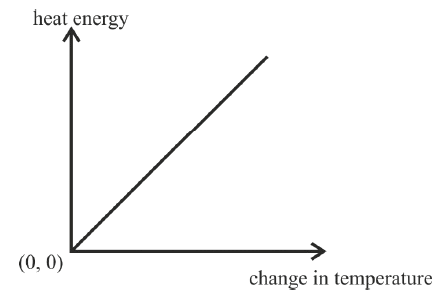
The graph given below shows heat energy supplied against change in temperature when no energy is lost to the surrounding. The slope of this graph will give :
- Specific heat capacity
- Latent heat of fusion
- Latent heat of vaporization
- Heat capacity
Calorimetry
10 Likes
Answer
Heat capacity
Reason — When no energy is lost to the surrounding, the amount of heat energy supplied is directly proportional to the change in temperature △t i.e.
Where,
m : mass of a substance
c : specific heat capacity of the substance
So,
And mc is the heat capacity (C) of the body
Hence, slope of Q vs △t graph gives the value of the heat capacity.
Answered By
5 Likes
Related Questions
Linear magnification(m) produced by a concave lens is :
- m < 1
- m > 1
- m = 1
- m = 2
A radioactive element is placed in an evacuated chamber. Then the rate of radioactive decay will:
- Decrease
- Increase
- Remain unchanged
- Depend on the surrounding temperature
A block of glass is pushed into the path of the light as shown below. Then the converging point X will :
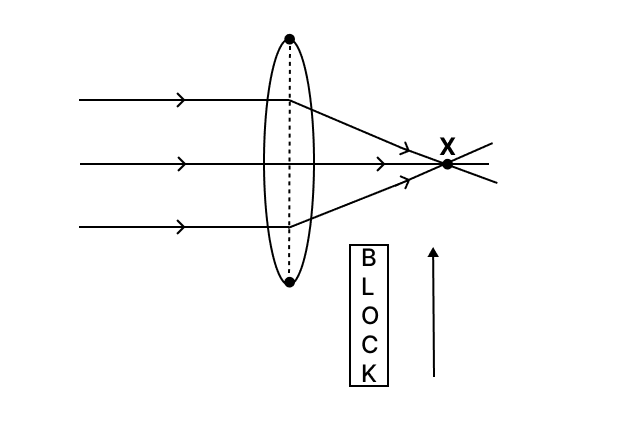
- Move away from the slab
- Move towards the slab
- Not shift
- Move towards the left side of the lens
(a) In the following atoms, which one is a radioisotope? Give one use of this isotope.
O16, C14, N14, He4
(b) Name the class of the lever shown in the picture below :