
Mathematics
The monthly income of a group of 320 employees in a company is given below :
| Monthly Income (in ₹) | No. of Employees |
|---|---|
| 6000 - 7000 | 20 |
| 7000 - 8000 | 45 |
| 8000 - 9000 | 65 |
| 9000 - 10000 | 95 |
| 10000 - 11000 | 60 |
| 11000 - 12000 | 30 |
| 12000 - 13000 | 5 |
Draw an ogive of the given distribution on a graph sheet taking 2 cm = ₹1000 on one axis and 2 cm = 50 employees on the other axis. From the graph, determine :
(i) The median wage.
(ii) The number of employees whose income is below ₹8500.
(iii) If the salary of a senior employee is above ₹11500, find the number of senior employees in the company.
(iv) The upper quartile.
Measures of Central Tendency
71 Likes
Answer
- The cumulative frequency table for the given continuous distribution is :
| Monthly Income (in ₹) | No. of Employees | Cumulative frequency |
|---|---|---|
| 6000 - 7000 | 20 | 20 |
| 7000 - 8000 | 45 | 65 |
| 8000 - 9000 | 65 | 130 |
| 9000 - 10000 | 95 | 225 |
| 10000 - 11000 | 60 | 285 |
| 11000 - 12000 | 30 | 315 |
| 12000 - 13000 | 5 | 320 |
Take 2 cm along x-axis = 1000 (₹)
Take 1 cm along y-axis = 50 (Employees)
Since, scale on x-axis starts at 6000, a kink is shown near the origin on x-axis to indicate that the graph is drawn to scale beginning at 6000.
Plot the points (7000, 20), (8000, 65), (9000, 130), (10000, 225), (11000, 285), (12000, 315) and (13000, 320) representing upper class limits and the respective cumulative frequencies.
Also plot the point representing lower limit of the first class i.e. 6000 - 7000.Join these points by a freehand drawing.
The required ogive is shown in figure above.
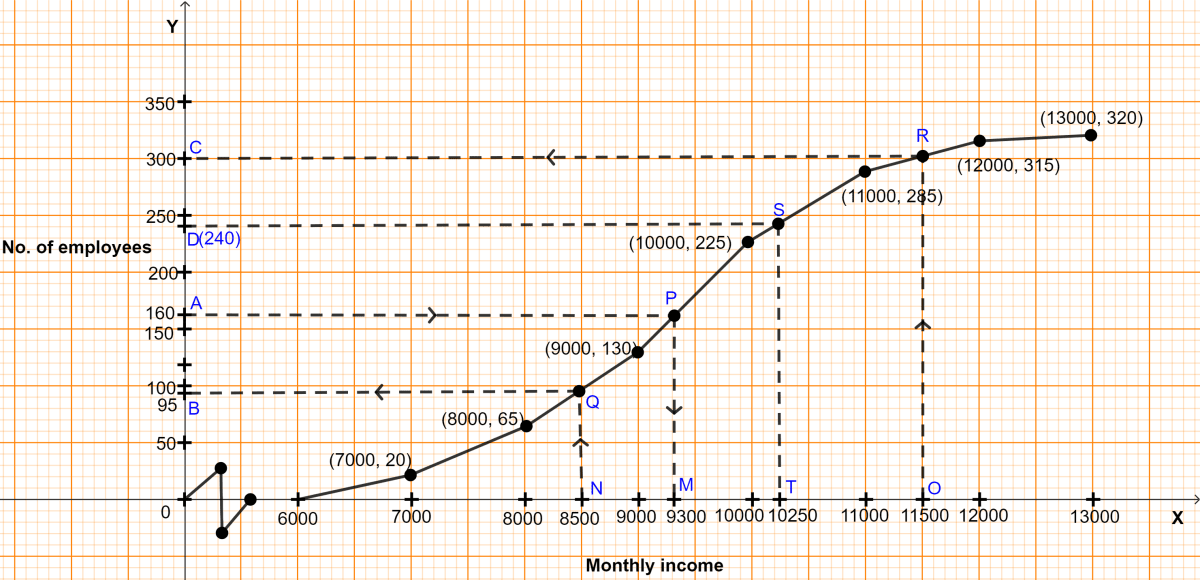
(i) Here, n (no. of students) = 320.
To find the median :
Let A be the point on y-axis representing frequency = = 160.
Through A draw a horizontal line to meet the ogive at P. Through P, draw a vertical line to meet the x-axis at M. The abscissa of the point M represents 9300.
Hence, the required median income = ₹9300.
(ii) Let N be the point on x-axis representing income = ₹8500.
Through N, draw a vertical line to meet the ogive at Q. Through Q, draw a horizontal line to meet the y-axis at B. The ordinate of the point B represents 95.
Hence, no. of employees earning less than ₹8500 = 95.
(iii) Let O be the point on x-axis representing income = ₹11500.
Through O, draw a vertical line to meet the ogive at R. Through R, draw a horizontal line to meet the y-axis at C. The ordinate of the point C represents 300.
No. of employees earning less than ₹11500 = 300
So, no. of employees earning more than ₹11500 = Total employees - employees earning less than ₹11500 = 320 - 300 = 20.
Hence, there are 20 senior employees in the company.
(iv) To find upper quartile :
Let D be the point on y-axis representing frequency = = 240.
Through D, draw a horizontal line to meet the ogive at S. Through S, draw a vertical line to meet the x-axis at T. The abscissa of the point T represents ₹10250.
Hence, upper quartile = ₹10250.
Answered By
11 Likes
Related Questions
Calculate the mean, the median and the mode of the following distribution :
Age in years No. of students 12 2 13 3 14 5 15 6 16 4 17 3 18 2 The daily canteen bill of 30 employees in an establishment are distributed as follows :
Daily canteen bill (in ₹) No. of employees 0 - 10 1 10 - 20 8 20 - 30 10 30 - 40 5 40 - 50 4 50 - 60 2 Estimate the modal daily canteen bill for this distribution by a graphical method.
Draw a cumulative frequency curve for the following data :
Marks obtained No. of students 0 - 10 8 10 - 20 10 20 - 30 22 30 - 40 40 40 - 50 20 Hence, determine :
(i) the median
(ii) the pass marks if 85% of the students pass.
(iii) the marks which 45% of the students exceed.
The given graph with a histogram represents the number of plants of different heights grown in a school campus. Study the graph carefully and answer the following questions :

(a) Make a frequency table with respect to the class boundaries and their corresponding frequencies.
(b) State the modal class.
(c) Identify and note down the mode of the distribution.
(d) Find the number of plants whose height range is between 80 cm to 90 cm.